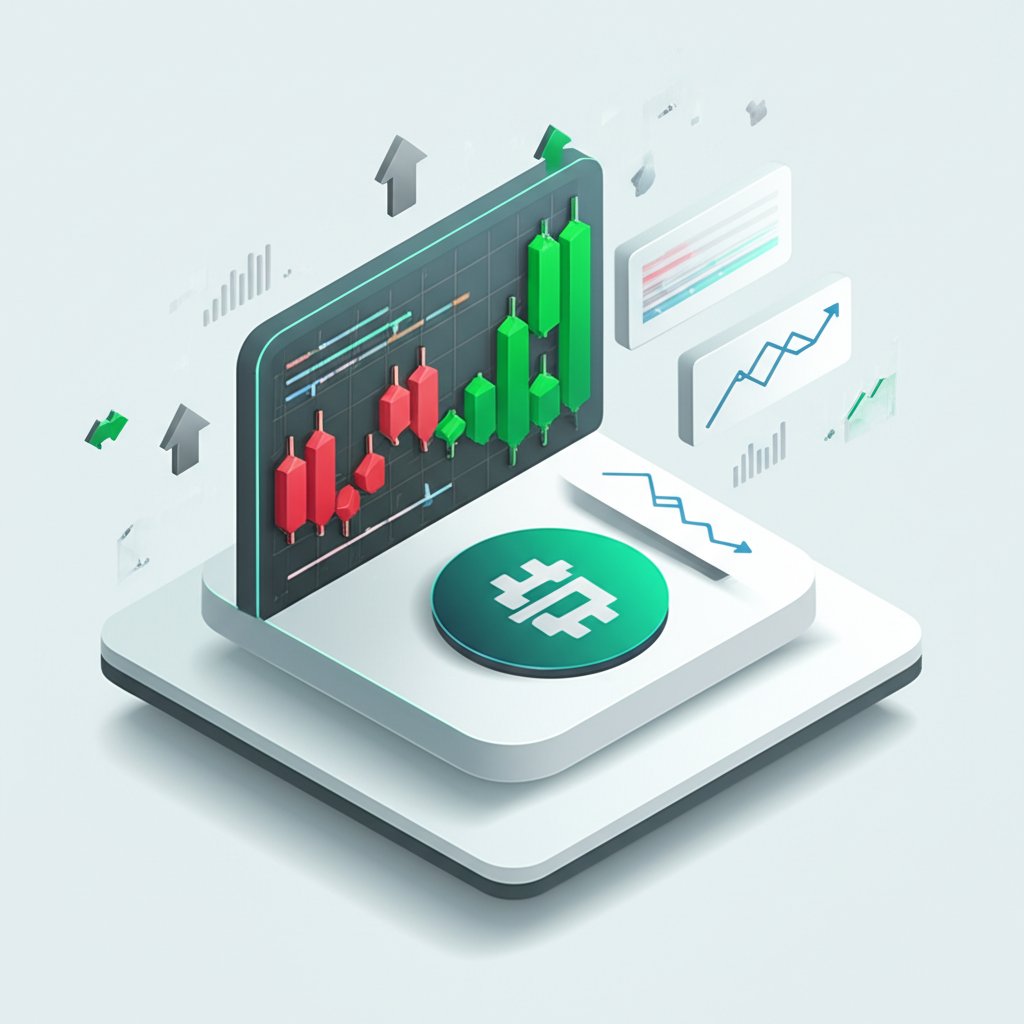
Trying to perfectly time the volatile crypto market often feels like chasing shadows. Is this a real dip, or just a temporary blip before another leg up? Deciphering when to buy or sell crypto is the perpetual challenge for every trader, from novice to veteran. Fortunately, a suite of powerful technical tools, known as "buy or sell crypto indicators," can shine a light on market sentiment, momentum, and potential price reversals, helping you make more informed decisions rather than relying on gut feelings.
At a Glance
- Identify Trend Directions: Learn how indicators like Moving Averages reveal prevailing market trends.
- Spot Overbought/Oversold Conditions: Discover tools like RSI and Stochastic Oscillator to gauge market extremes.
- Confirm Reversal Points: Understand how Fibonacci Retracement and Candlestick patterns pinpoint potential trend changes.
- Gauge Trend Strength: Use Volume and ADX to assess the conviction behind price movements.
- Combine for Confluence: Master the art of using multiple indicators to build higher-probability trade setups.
- Recognize Limitations: Understand when indicators might mislead and how to mitigate those risks.
The Indicator Advantage: Translating Market Noise into Actionable Signals
In the fast-paced world of cryptocurrency, price charts are more than just pretty lines; they're a rich source of data, full of signals about supply, demand, and market psychology. Technical indicators distill this complex data—like price, volume, and volatility—into digestible visual cues. Their primary role? To help you identify potential entry (buy) and exit (sell) points, anticipate market shifts, and confirm the strength of a trend. They don't predict the future with 100% accuracy, but they empower you to react strategically to what the market is telling you.
Essential Buy or Sell Crypto Indicators for Every Trader's Toolkit
Let's break down the most effective indicators, focusing on how they translate market data into clear buy or sell signals.
Simple Moving Averages (SMA): Your Compass for Trend Direction
What it is: The SMA calculates the average price of a cryptocurrency over a specified period. It smooths out price action, making the underlying trend clearer.
How it signals buy/sell:
- Buy Signal (Bullish): When the current price crosses above its SMA, it suggests bullish momentum. For instance, if Bitcoin's price moves above its 50-day SMA, it often signals an emerging uptrend. Short-term traders might use a 5 or 10-day SMA, while long-term investors might eye the 100 or 200-day SMA.
- Sell Signal (Bearish): Conversely, when the price crosses below its SMA, it indicates bearish pressure and a potential downtrend.
- Golden/Death Cross: A powerful signal occurs when two SMAs cross. A "Golden Cross" (shorter-term SMA crosses above longer-term SMA, e.g., 50-day above 200-day) is a strong buy signal. A "Death Cross" (shorter-term below longer-term) is a strong sell signal.
Example: Imagine Ethereum's price has been consolidating. Suddenly, its 20-day SMA crosses above its 50-day SMA, and the price is also trading above both. This confluence suggests increasing bullish momentum, potentially signaling a buy.
Relative Strength Index (RSI): Gauging Overbought and Oversold Zones
What it is: The RSI is a momentum oscillator, measuring the speed and change of price movements. It ranges from 0 to 100, typically over 14 periods (days, hours, etc.).
How it signals buy/sell:
- Buy Signal (Oversold): An RSI reading below 30 indicates the asset is oversold. This suggests buying pressure might be accumulating, and a price bounce could be imminent.
- Sell Signal (Overbought): An RSI reading above 70 indicates the asset is overbought. This means it might be due for a price correction or a reversal.
- Divergence: A powerful signal is divergence, where price makes a lower low, but RSI makes a higher low (bullish divergence, potential buy), or price makes a higher high, but RSI makes a lower high (bearish divergence, potential sell).
Example: If Solana's price has been dropping rapidly, pushing its 14-day RSI down to 25, it might be an opportune moment to consider buying, anticipating a market reversal.
Moving Average Convergence Divergence (MACD): Uncovering Trend Changes and Momentum
What it is: MACD shows the relationship between two exponential moving averages (EMAs) and is a momentum indicator used to identify trend changes. It consists of the MACD line, a signal line (an EMA of the MACD line), and a histogram.
How it signals buy/sell:
- Buy Signal: A bullish crossover occurs when the MACD line crosses above its signal line. This suggests accelerating upward momentum.
- Sell Signal: A bearish crossover occurs when the MACD line crosses below its signal line, indicating weakening bullish momentum or increasing bearish momentum.
- Histogram: The histogram's height shows the distance between the MACD and signal lines. A widening histogram above zero indicates strong bullish momentum, while a widening histogram below zero indicates strong bearish momentum.
Example: You observe that a Bitcoin MACD line, after trending downwards, has just crossed above its signal line, with the histogram turning positive. This could be a strong buy signal, indicating a shift from bearish to bullish momentum.
Stochastic Oscillator: Another Perspective on Market Extremes
What it is: Similar to RSI, the Stochastic Oscillator is a momentum indicator comparing a closing price to its price range over a specific period (usually 14 periods). It ranges from 0 to 100.
How it signals buy/sell:
- Buy Signal (Oversold): A reading below 20 suggests the asset is oversold, implying a potential bounce.
- Sell Signal (Overbought): A reading above 80 suggests the asset is overbought, indicating a potential correction or reversal.
Example: If Dogecoin's price is flatlining but its Stochastic Oscillator dips below 20, it could signal that selling pressure is exhausted, and a small upward movement is due.
Bollinger Bands: Measuring Volatility and Potential Reversals
What it is: Bollinger Bands consist of a middle band (a Simple Moving Average) and two outer bands that are standard deviations above and below the middle band. They expand and contract with volatility.
How it signals buy/sell:
- Buy Signal (Oversold): When the price touches or breaks below the lower band, it can indicate an oversold condition, suggesting a potential bounce back towards the middle band.
- Sell Signal (Overbought): When the price touches or breaks above the upper band, it can indicate an overbought condition, suggesting a potential pullback.
- Squeeze and Expansion: A "Bollinger Squeeze" (bands narrow) often precedes a period of high volatility, signaling a potential breakout in either direction.
Example: When Cardano's price has a strong upward move and repeatedly touches the upper Bollinger Band, it might be signaling an overextended move, suggesting a potential selling opportunity before a correction.
Parabolic SAR (Stop and Reverse): Trailing Trends and Entry/Exit Points
What it is: Parabolic SAR places dots on a chart, indicating potential entry and exit points. It's excellent for trending markets.
How it signals buy/sell:
- Buy Signal: When the dots appear below the price candles, it signals an uptrend or a potential buy opportunity.
- Sell Signal: When the dots appear above the price candles, it signals a downtrend or a potential sell opportunity. The "stop and reverse" nature means it flips from buy to sell, or vice-versa, when the trend reverses.
Example: If Polygon (MATIC) is in a clear uptrend and the Parabolic SAR dots are consistently below the price candles, a sudden appearance of a dot above the most recent candle could be a signal to sell or take profits, as the trend might be reversing.
Volume Indicator and On-Balance Volume (OBV): Confirming Trend Strength
What they are:
- Volume Indicator: Simply shows the number of assets traded over a period.
- On-Balance Volume (OBV): A cumulative total of volume, adding volume on up days and subtracting on down days.
How they signal buy/sell: - Buy/Sell Confirmation: A significant price movement accompanied by high volume suggests a stronger, more sustainable trend. Low volume on a price move makes the trend less reliable.
- OBV Divergence: If the price is making higher highs but OBV is making lower highs, it indicates buying interest is waning (bearish divergence – potential sell). Conversely, if price makes lower lows but OBV makes higher lows, it suggests accumulation (bullish divergence – potential buy).
Example: If Bitcoin suddenly surges, but the trading volume remains low, this might be a "fakeout" or weak rally. A strong, sustained rally would ideally be backed by robust, increasing volume, confirming a buy.
Fibonacci Retracement: Pinpointing Support and Resistance
What it is: Fibonacci Retracement uses horizontal lines to identify potential support and resistance levels at key Fibonacci ratios (e.g., 23.6%, 38.2%, 50%, 61.8%, 78.6%) after a significant price move.
How it signals buy/sell:
- Buy Signal: After an uptrend, price often "retraces" to a Fibonacci support level before continuing its ascent. These levels (e.g., 61.8%) can be strong buy zones.
- Sell Signal: After a downtrend, price might bounce to a Fibonacci resistance level before continuing its decline. These levels can be potential sell zones.
Example: Avalanche (AVAX) experiences a strong rally, then pulls back. If it finds strong buying interest and reverses at the 0.618 Fibonacci retracement level, that level acts as a key support, potentially signaling a good entry point.
Average Directional Index (ADX): Measuring Trend Strength, Not Direction
What it is: The ADX measures the strength of a trend, ranging from 0 to 100. It doesn't tell you if it's an uptrend or downtrend, only how strong the current trend is.
How it confirms buy/sell:
- Strong Trend Confirmation: An ADX reading above 50 indicates a very strong trend, making signals from other directional indicators (like SMA crosses or MACD) more reliable.
- Weak Trend Caution: An ADX reading below 20 suggests a weak or non-trending market. In such conditions, trend-following indicators are less effective, and range-bound strategies might be more appropriate.
Example: If your MACD just gave a buy signal for Ripple (XRP), and the ADX simultaneously jumps above 50, it adds significant confidence to that buy signal, indicating a strong, potentially sustained move.
Candlestick Patterns: Visual Cues for Reversals
What it is: Individual candlesticks or combinations of a few reveal market sentiment through their shape, body, and wicks.
How it signals buy/sell:
- Buy Signal (Bullish Reversal): Patterns like the "Hammer" (small body at top, long lower wick) appearing at the bottom of a downtrend signal buyers stepping in. A "Bullish Engulfing" (large green candle completely covers previous red candle) is another strong buy indicator.
- Sell Signal (Bearish Reversal): Patterns like the "Shooting Star" (small body at bottom, long upper wick) at the top of an uptrend indicate sellers pushing prices down. A "Bearish Engulfing" (large red candle covers previous green candle) is a powerful sell signal. The "Doji" (cross shape, close equals open) signals market indecision and potential reversal.
Example: After several red candles in a row for Chainlink (LINK), a large green candle completely engulfs the previous day's red candle. This bullish engulfing pattern can signal a shift in momentum and a potential buy opportunity.
The Power of Confluence: Layering Indicators for Higher Confidence
No single buy or sell crypto indicator is perfect on its own. The real strength comes from using multiple indicators together to build a "confluence" of signals. When two or three different indicators are all flashing the same buy or sell signal, your confidence in that trade setup increases significantly.
Scenario: You're looking at Bitcoin and notice:
- The price has just crossed above its 50-day SMA (bullish trend confirmation).
- The RSI is moving up from the oversold territory (momentum shift).
- The MACD line has crossed above its signal line (bullish crossover).
- Volume is increasing with the price (trend strength confirmation).
This combination provides a much stronger buy signal than any single indicator alone. It's a holistic approach to understanding market dynamics, a critical skill for maximizing your trading success. If you're looking for more advanced strategies and frameworks for combining these tools, you'll find a deeper dive in our broader guide: Maximize trading with indicators.
Navigating the Nuances: Limitations and Smart Practices
While incredibly helpful, buy or sell crypto indicators aren't infallible.
- Lagging vs. Leading: Some indicators are lagging (e.g., MACD, SMAs) – they confirm trends already in progress. Others are leading (e.g., RSI, Stochastic) – they attempt to predict future movements. Using both provides a balanced view.
- Market Conditions Matter: Indicators are most reliable in trending markets (Parabolic SAR, ADX) or clear range-bound markets (RSI, Bollinger Bands). They can give false signals in choppy, consolidating markets.
- Fundamental Overrides: Breaking news, regulatory changes, or major project developments (fundamental factors) can instantly override any technical indicator signal. Always be aware of the broader crypto news landscape.
- Liquidity and Market Cap: Indicators tend to be most accurate for established, large-cap cryptocurrencies (like Bitcoin and Ethereum) with high liquidity and extensive historical data. For newer, low-volume altcoins, indicator signals can be less reliable due to easier manipulation and thinner order books.
Beyond the Traditional: Adding Depth with Advanced Insights
While standard indicators are a powerful foundation, some traders also integrate more advanced tools for a holistic view. This can include:
- Buying/Selling Pressure Heatmaps: Visualizing where large orders are being placed on exchanges to identify strong support/resistance zones.
- Sentiment Heatmaps: Gauging the overall market psychology (e.g., fear vs. greed) from social media, news, and on-chain data.
- Volume Momentum Indexes: Analyzing the sustainability and conviction behind volume movements, often revealing hidden accumulation or distribution.
These tools offer a real-time, granular look at market dynamics, complementing traditional indicators by revealing underlying forces.
Your Practical Playbook: Implementing Buy or Sell Crypto Indicators
Ready to put these insights into action? Here's a quick guide:
- Define Your Strategy: Are you a day trader, swing trader, or long-term investor? This determines which indicator timeframes and combinations suit you best.
- Day Trader: Focus on 5, 15, 30-minute charts. Use fast SMAs (5/10), quick RSI/Stochastic (e.g., 7-period), MACD.
- Swing Trader: Focus on 4-hour, daily charts. Use SMAs (20/50), standard RSI/Stochastic (14-period), MACD.
- Long-term Investor: Focus on daily, weekly charts. Use slow SMAs (100/200), broader RSI/Stochastic (21-period), OBV, ADX.
- Select Your Core Indicators: Choose 2-4 indicators that complement each other (e.g., one trend-following, one momentum, one volatility). A common combination is SMA, RSI, and MACD.
- Practice on a Demo Account: Before risking real capital, practice interpreting signals and making trades on a paper trading account. This builds confidence without financial risk.
- Set Alerts: Most trading platforms allow you to set alerts for indicator crossovers or specific levels. This saves you from constantly staring at charts. For example, an alert for when RSI drops below 30 on your target crypto.
- Develop a Confirmation Checklist: Before entering a trade, ensure your chosen indicators align. For a "buy," you might need: Price above 20-day SMA, RSI breaking above 30, MACD bullish crossover.
Case Snippet: A Swing Trade Entry
You're eyeing Polygon (MATIC) on a 4-hour chart.
- Observation 1 (SMA): MATIC price has just crossed above its 50-period SMA.
- Observation 2 (RSI): The 14-period RSI was at 28 (oversold) and is now rising towards 40.
- Observation 3 (MACD): The MACD line has just crossed above its signal line, and the histogram is turning green.
- Observation 4 (Volume): The breakout above the SMA occurred on higher-than-average volume.
- Decision: With confluence from multiple indicators pointing to a bullish reversal and strong momentum, you initiate a long position (buy).
Quick Answers: Your Indicator FAQs
Q: Can I rely on just one buy or sell crypto indicator?
A: Not advisable. Relying on a single indicator significantly increases the risk of false signals. Always seek confluence from at least two, preferably three, complementary indicators.
Q: Are leading or lagging indicators better?
A: Neither is inherently "better"; they serve different purposes. Leading indicators (like RSI) can offer early warnings but are prone to false positives. Lagging indicators (like MACD) confirm trends with higher accuracy but provide signals later. A robust strategy uses both.
Q: Do these indicators work for all cryptocurrencies?
A: They are most reliable for established, liquid cryptocurrencies (e.g., Bitcoin, Ethereum, large-cap altcoins) with consistent trading data. For small-cap or very new tokens with low volume, indicator signals can be easily skewed or misleading.
Q: How often should I check my indicators?
A: This depends on your trading style. Day traders might check 5-minute or 15-minute charts frequently, while swing traders might check 4-hour or daily charts once or twice a day. Long-term investors may only check weekly. Don't overtrade due to constant checking.
Q: What's the biggest mistake new traders make with indicators?
A: The most common mistake is blindly following signals without understanding the underlying market context or without confirmation from other indicators. Another mistake is using too many indicators, leading to "analysis paralysis." Simplicity and confluence are key.
Your Next Move: Actionable Takeaways for Smarter Trades
Mastering "buy or sell crypto indicators" is a journey, not a destination. Start by deeply understanding a few key indicators, then gradually build your own customized toolkit. The goal isn't perfect predictions, but rather to shift from reactive, emotional trading to proactive, strategic decision-making. Focus on:
- Simplicity First: Don't overload your charts. Pick 2-4 indicators you understand well.
- Seek Confluence: Always confirm signals across multiple indicators before acting.
- Context is King: Always consider the broader market trend, news, and the specific crypto's characteristics.
- Risk Management: Indicators help with entry/exit, but sound risk management (stop-losses, position sizing) remains paramount.
- Continuous Learning: Markets evolve, and so should your understanding. Keep exploring, testing, and refining your approach.
By integrating these powerful tools into your trading routine, you'll gain a clearer perspective on market dynamics, allowing you to spot reversals, confirm trends, and ultimately make more confident buy or sell decisions in the exciting, yet challenging, world of cryptocurrency.