When you're navigating the volatile seas of cryptocurrency, a bitcoin candle chart isn't just a pretty graph; it’s your compass, map, and weather forecast all rolled into one. These vibrant visualizations offer a condensed story of price action, giving savvy traders a powerful edge in predicting potential market movements. Forget gut feelings – understanding these charts allows you to decipher the collective psychology of buyers and sellers, often signaling future trends before they become obvious.
Think of it as learning the secret language of the market. Each "candle" on the chart tells you a detailed story about Bitcoin's price over a specific period, revealing much more than a simple line graph ever could. It’s an essential skill, whether you're a day trader making rapid decisions or a long-term investor seeking opportune entry and exit points.
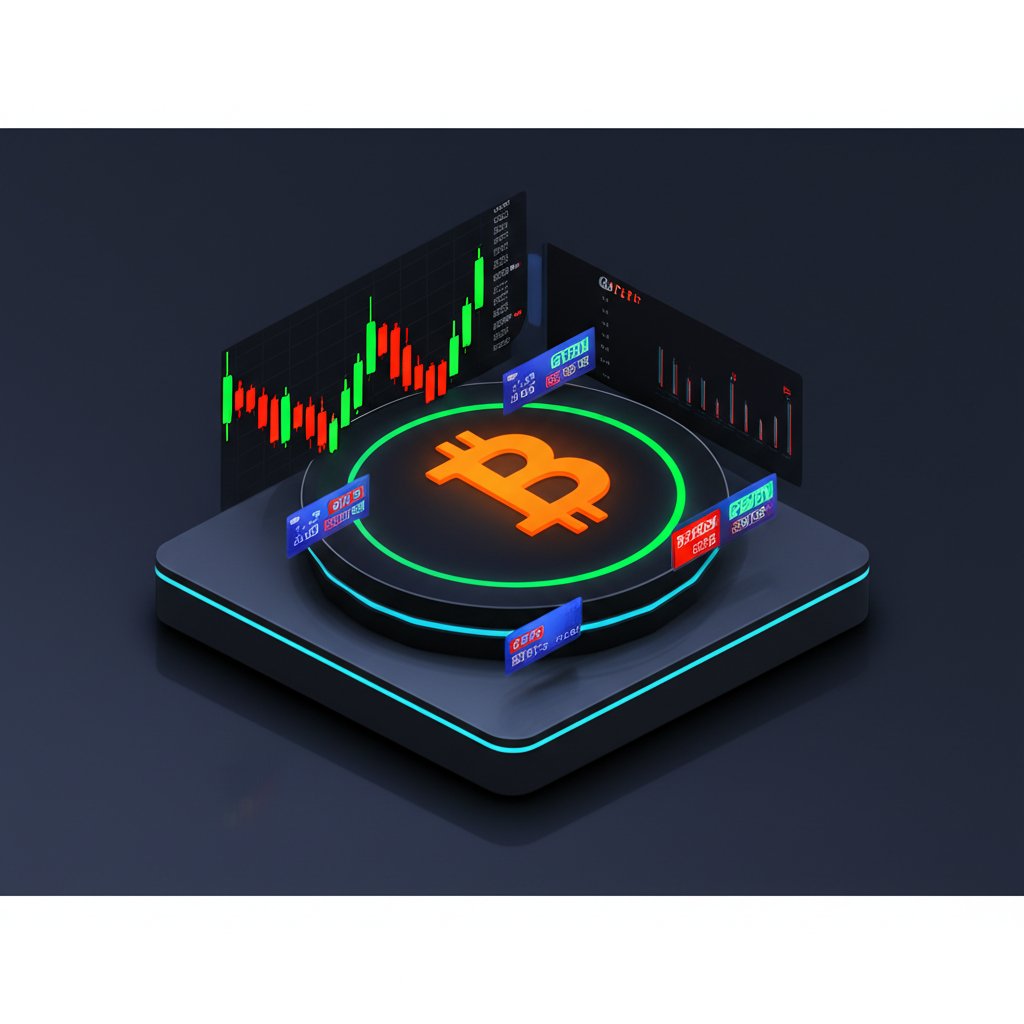
At a Glance: Your Quick Guide to Bitcoin Candle Charts
- What they are: Visual representations of Bitcoin's price movement (open, high, low, close) over specific timeframes.
- Why they matter: They reveal market sentiment and potential future price direction through patterns.
- Key components: Body (open/close price) and wicks (high/low price).
- Colors mean: Green/white typically indicates an upward move; red/black signifies a downward move.
- Timeframes: Can be set for minutes, hours, days, or weeks, impacting the insights you gain.
- Pattern power: Specific candlestick patterns suggest bullish reversals, bearish reversals, or continuation of trends.
- Not a crystal ball: Candle charts are predictive tools, not guarantees. Always confirm with other indicators.
The Anatomy of a Bitcoin Candle: Unpacking the Story

Before you can predict where Bitcoin might go, you need to understand where it's been. Every single candle on your chart is a data-rich snapshot of price action within a selected timeframe – be it one minute, four hours, or a full day.
Let's break down the core components:
- The Body: This is the thick rectangular part of the candle. It represents the range between the opening price and the closing price.
- Green/White Body: Indicates that the closing price was higher than the opening price. Buyers were in control, pushing the price up.
- Red/Black Body: Shows that the closing price was lower than the opening price. Sellers dominated, driving the price down.
- The Wicks (or Shadows): These are the thin lines extending from the top and bottom of the body. They illustrate the highest and lowest prices Bitcoin reached during that specific timeframe.
- Upper Wick: The top of the upper wick marks the highest price Bitcoin traded at.
- Lower Wick: The bottom of the lower wick indicates the lowest price Bitcoin reached.
By observing these four data points – open, high, low, and close – you gain immediate insight into the battle between buyers and sellers. A long green body suggests strong buying pressure, while a long red body points to aggressive selling. Short bodies and long wicks, on the other hand, often signal indecision or a potential shift in momentum.
Timeframes: Your Lens for Different Market Views
One of the most powerful, yet often overlooked, aspects of using a bitcoin candle chart is the ability to adjust its timeframe. This allows you to zoom in for granular detail or zoom out for the bigger picture, offering crucial context for any trading decision.
- Short Timeframes (e.g., 1-minute, 5-minute, 15-minute): Ideal for day traders or scalpers looking to capitalize on rapid price fluctuations. These charts show immediate market sentiment and are crucial for entries and exits in fast-paced environments. However, they can also generate a lot of "noise" and false signals.
- Medium Timeframes (e.g., 1-hour, 4-hour): Often favored by swing traders who hold positions for hours or days. These provide a more stable view than very short timeframes, allowing for better identification of intra-day trends without getting overwhelmed by every minor movement.
- Long Timeframes (e.g., Daily, Weekly, Monthly): Essential for long-term investors or those looking to understand overarching market trends. Daily and weekly charts filter out short-term volatility, presenting a clearer view of major support and resistance levels, and the fundamental direction of the market. Consulting these charts helps confirm trends identified on shorter timeframes.
The key is to use multiple timeframes. A bearish pattern on a 15-minute chart might be irrelevant if the daily chart shows a strong underlying bullish trend. Always consider the larger context when Understanding BTC Candlestick Charts across different periods.
Deciphering Key Candlestick Patterns: Reading the Market's Signals
Now that you understand the basic building blocks, let's dive into the patterns these candles form. These patterns are not random; they are visual representations of historical human psychology interacting with asset prices. Recognizing them can provide incredibly valuable clues about future price direction.
Platforms like Investing.com often offer real-time candlestick pattern recognition, highlighting dozens of bullish and bearish signals for Bitcoin, which can be immensely helpful for gaining a trading edge. Let's explore some of the most common and powerful ones.
Bullish Reversal Patterns: Signs of an Upturn
These patterns typically appear after a downtrend, suggesting that selling pressure is weakening and buyers are beginning to take control, potentially leading to a price increase.
- Hammer:
- Appearance: Small body (green or red) near the top of the trading range, with a long lower wick (at least twice the length of the body) and little to no upper wick.
- Meaning: Even though sellers pushed the price down significantly during the period, buyers managed to push it back up near the open. This signals strong buying interest and a rejection of lower prices.
- Context: Most potent when appearing after a clear downtrend.
- Bullish Engulfing:
- Appearance: A small red candle is completely enveloped (engulfed) by a subsequent large green candle.
- Meaning: The second candle's open is below the first's close, and its close is above the first's open, indicating a dramatic shift from selling to buying pressure. It signifies that buyers have aggressively taken control, overwhelming the previous selling activity.
- Context: A powerful reversal signal when seen at the bottom of a downtrend.
- Morning Star:
- Appearance: Three candles: a long red candle, followed by a small-bodied candle (could be green or red, often a Doji or spinning top) that "gaps" down, and finally, a long green candle that closes well into the body of the first red candle.
- Meaning: The first red candle confirms the downtrend. The second small candle shows indecision or a slowdown in selling. The third green candle confirms renewed buying pressure, often signaling a strong reversal.
- Context: A robust bullish reversal pattern.
Bearish Reversal Patterns: Warning Signs of a Downturn
These patterns typically emerge after an uptrend, indicating that buying power is fading and sellers are gaining momentum, potentially leading to a price decline.
- Hanging Man:
- Appearance: Identical in shape to a Hammer (small body near the top, long lower wick), but appears during an uptrend.
- Meaning: While buyers pushed the price up, sellers managed to push it significantly lower during the period, only for buyers to pull it back up. This shows that selling pressure is entering the market, and the uptrend might be losing steam.
- Context: A bearish signal when formed at the top of an uptrend.
- Bearish Engulfing:
- Appearance: A small green candle is completely enveloped by a subsequent large red candle.
- Meaning: The second candle's open is above the first's close, and its close is below the first's open. This shows that sellers have overwhelmed buyers, indicating a strong shift from buying to selling pressure.
- Context: A powerful reversal signal when seen at the top of an uptrend.
- Evening Star:
- Appearance: Three candles: a long green candle, followed by a small-bodied candle (Doji or spinning top) that "gaps" up, and finally, a long red candle that closes well into the body of the first green candle.
- Meaning: The first green candle confirms the uptrend. The second small candle shows indecision at the peak. The third red candle confirms renewed selling pressure, often signaling a strong reversal.
- Context: A robust bearish reversal pattern.
Continuation Patterns: Reinforcing the Trend
These patterns suggest that the current trend is likely to continue after a brief pause or consolidation.
- Doji:
- Appearance: A very small or non-existent body, with upper and lower wicks of varying lengths. The open and close prices are nearly identical.
- Meaning: Represents indecision in the market. Neither buyers nor sellers were able to gain significant control. While often a reversal signal when appearing after a strong trend, it can also signify a brief pause before the trend continues.
- Context: Its significance largely depends on the preceding candles and the overall trend.
- Spinning Top:
- Appearance: Small body (green or red) with relatively long upper and lower wicks, indicating significant movement in both directions during the period, but ultimately closing near the open.
- Meaning: Similar to a Doji, it signifies indecision. There's a balance between buying and selling pressure. It often appears during consolidation phases.
- Context: Can precede a reversal or simply be a temporary lull in a strong trend.
Understanding these patterns, as well as looking up candlestick charts for current Bitcoin prices and patterns on sites like CandleCharts.com, is fundamental to developing your market intuition.
Putting It All Together: Strategies for Predicting Crypto Market Moves
Recognizing individual candlestick patterns is a great start, but true predictive power comes from combining them with other technical analysis tools and understanding the broader market context. No single indicator or pattern is 100% accurate; confirmation is key.
1. Confirm with Volume
Volume is your best friend when validating candlestick patterns. It represents the number of Bitcoin units traded during that specific candle's timeframe.
- High Volume on Reversal Patterns: A bullish engulfing pattern occurring with significantly higher volume than preceding candles adds strong conviction to the reversal signal. Similarly, a bearish engulfing pattern on high volume suggests powerful selling pressure.
- Low Volume on Reversal Patterns: If a reversal pattern appears on low volume, its signal is weaker and should be treated with caution. It might just be a temporary blip rather than a true shift in momentum.
2. Identify Support and Resistance Levels
These are crucial price levels where Bitcoin has historically struggled to move above (resistance) or below (support).
- Support: A price level where buying interest is strong enough to halt a downtrend and potentially reverse it.
- Resistance: A price level where selling interest is strong enough to halt an uptrend and potentially reverse it.
- Candlesticks at S/R: When a bullish reversal pattern (like a Hammer) forms exactly at a strong support level, it's a very compelling buy signal. Conversely, a bearish reversal pattern (like a Hanging Man) forming at a resistance level is a strong sell signal.
3. Draw Trend Lines
Trend lines visually connect a series of higher lows (uptrend) or lower highs (downtrend), indicating the market's direction.
- Uptrend Line: Connects the lows of an ascending market.
- Downtrend Line: Connects the highs of a descending market.
- Interaction with Candlesticks: A bullish reversal pattern appearing on an established uptrend line can signal a bounce and continuation of the trend. A bearish pattern breaking below an uptrend line can signal a reversal.
4. Multiple Time Frame Analysis (MTFA)
This is where you integrate insights from different timeframes.
- The "Top-Down" Approach: Start with a longer timeframe (e.g., daily or 4-hour) to identify the major trend and key support/resistance levels.
- Zoom In for Entry/Exit: Then, switch to a shorter timeframe (e.g., 1-hour or 15-minute) to spot precise entry or exit points using candlestick patterns within the context of the larger trend.
- Confirmation: A bullish pattern on a short timeframe is much more reliable if the larger timeframe trend is also bullish.
For example, if the daily chart shows Bitcoin in a clear uptrend and approaching a significant support level, switching to a 1-hour chart and spotting a bullish engulfing pattern there offers a higher-probability entry point. This holistic view is vital for making informed decisions when Understanding BTC Candlestick Charts for trading.
Common Pitfalls & Misconceptions: What to Avoid
Even with the best tools, it's easy to stumble. Here are common mistakes to steer clear of when using bitcoin candle charts:
- Treating Patterns as Guarantees: No candlestick pattern is 100% accurate. They are probabilities, not certainties. Always manage your risk accordingly.
- Ignoring Market Context: A Hammer in isolation is just a shape. A Hammer at the bottom of a prolonged downtrend, on high volume, near a strong support level, is a powerful signal. Context is everything. Don't trade in a vacuum.
- Over-reliance on Short Timeframes: While good for quick trades, short-term charts (e.g., 1-minute, 5-minute) can be very noisy and prone to false signals. Always cross-reference with longer timeframes.
- "Pattern Hunting" Bias: Don't try to force patterns where they don't exist. Let the chart speak to you rather than projecting what you want to see onto it.
- Ignoring Fundamental News: While technical analysis focuses on price action, major news events (e.g., regulatory changes, macro-economic shifts, major hacks) can override any chart pattern. Stay informed.
- Lack of Confirmation: Trading purely on one candlestick pattern without other confirming indicators (volume, support/resistance, other technical indicators) is like driving with one eye closed. Always seek confluence of signals.
A Mini Case Study: Bitcoin's Recent Reversal (Hypothetical)
Imagine Bitcoin has been in a steady downtrend for a few weeks, making lower lows and lower highs. On the daily chart, you notice the price approaching a key historical support level around $X,XXX.
- Day 1: Bitcoin forms a long red candle, confirming the selling pressure.
- Day 2: The price opens lower but then buyers step in aggressively. Although the close is still slightly below the open, the candle forms a clear Hammer pattern with a long lower wick, right at the $X,XXX support level. Volume is slightly elevated compared to previous days. This catches your attention.
- Day 3: The very next day, Bitcoin opens significantly higher than the previous day's close and closes even higher, creating a large green candle that completely engulfs the body of the Hammer candle. Volume is even higher than Day 2. This is a powerful Bullish Engulfing pattern, confirming the reversal.
Interpretation: The Hammer at support showed rejection of lower prices. The subsequent Bullish Engulfing with high volume provides strong confirmation that buyers have taken control, signaling a high probability of a short-term uptrend or at least a significant bounce. This would be an opportune moment for a swing trader to consider a long position, perhaps setting a stop-loss just below the low of the Hammer's wick.
Beyond the Basics: Advanced Tips for Chart Mastery
Once you're comfortable with the fundamentals of Understanding BTC Candlestick Charts, you can begin to explore more advanced techniques:
- Heikin Ashi Candles: These modified candles smooth out price action, making trends and reversals easier to spot by averaging prices. They can reduce noise but might lag traditional candlesticks slightly.
- Renko Charts: These charts filter out time and only plot price movements of a certain magnitude, giving a very clear picture of sustained trends and reversals.
- Ichimoku Cloud: A complex but powerful indicator that provides support/resistance levels, trend direction, and momentum all in one.
- Fibonacci Retracements: Using these tools, you can identify potential support and resistance levels based on mathematical ratios that often appear in natural and market phenomena. Combining these with candlestick patterns at key Fibonacci levels can offer high-probability trade setups.
- Divergence Analysis: Looking for discrepancies between price action and momentum indicators (like RSI or MACD). For instance, if Bitcoin makes a new higher high, but the RSI makes a lower high, it could signal a weakening trend, even if candlesticks look strong.
Common Questions About Bitcoin Candle Charts
Are Bitcoin candle charts reliable for all cryptocurrencies?
Yes, the principles of candlestick analysis apply universally to any asset with price data, including Ethereum, Ripple, Litecoin, and thousands of other altcoins. The patterns reflect universal market psychology.
How many candles should I look at for analysis?
The number of candles depends on your timeframe and trading style. For short-term day trading, you might focus on the last 50-100 candles on a 5-minute chart. For long-term investing, you'd examine hundreds of daily or weekly candles to see the larger trend. A general rule of thumb is to look back far enough to understand the recent significant market moves and patterns.
Can I automate candlestick pattern recognition?
Many trading platforms and charting software (like TradingView, MetaTrader, or those highlighted by Investing.com) offer built-in features for automatic candlestick pattern recognition. These can be excellent starting points, but always confirm the signals with your own analysis and other indicators.
What's the biggest mistake beginners make with candle charts?
The most significant mistake is trading based on a single candlestick pattern in isolation, without confirming signals from volume, support/resistance, or higher timeframes. This leads to low-probability trades and increased risk.
Taking Your Bitcoin Chart Analysis Further
Mastering the bitcoin candle chart is an ongoing journey, not a destination. It requires practice, patience, and continuous learning. Start by observing charts daily, identifying patterns, and seeing how they play out. Don't jump into live trading with significant capital until you've gained confidence in your ability to interpret these signals consistently.
Consider using a demo account to practice identifying patterns and making hypothetical trades. Log your observations: what patterns did you see? What did you expect to happen? What actually happened? This systematic approach will refine your intuition and transform your understanding of the market from guesswork to educated insight. The crypto market is dynamic, but with the right tools and knowledge, you can navigate its waves with greater confidence and precision.